Table of Contents
This is one of those posts that I didn’t really want to write at first, since it’s about meta blogging which reminds me on those sad blogs that started 5 years ago with “How I write my blog” post and then the stream of ideas fizzled and the blog never got anywhere.
A lot of people are wondering how much traffic comes from the post that sits on the front page of Hacker News or how to prepare your server in case one of your posts ever goes viral and hopefully this post will shed some light on this topic. Somehow two of my posts happened to appear on the frontpage at the same time (posts 4 and 5 on the screenshot below) and I was able to get the traffic numbers from the server logs.

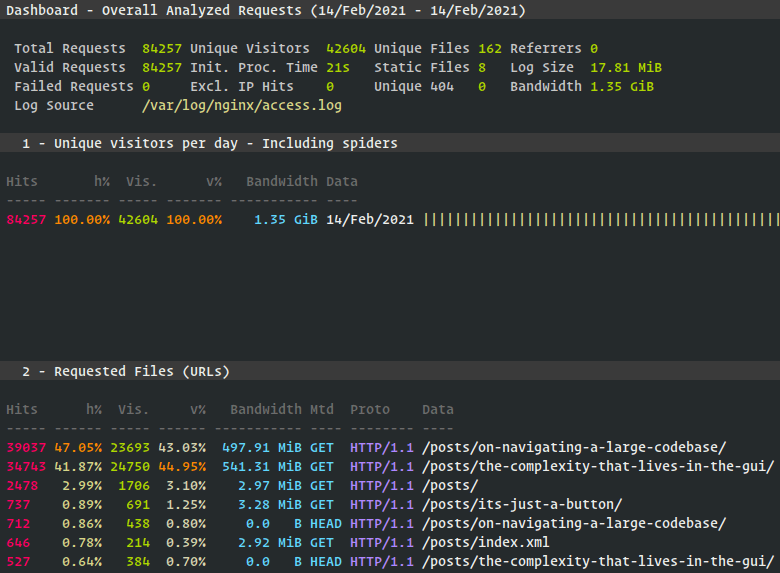
In the first 20 hours we served ~85,000 requests out of which ~43,000 were unique. Keep in mind some of them are bots, so we served our pages to less than 86,000 eyeballs. All requests up to this point came from Hacker News which means that each post on the front page brought roughly ~20,000 unique requests. After the first 20 hours one of the posts was also reposted on Reddit, which further increased the traffic numbers described in the next section.
The reported bandwidth from the screenshot is wrong as it represents only the bandwidth that was spent for serving html pages, since the static asset requests are not logged.
Traffic
The following tables contain data from 2021-02-14 to 2021-02-15 and contains information about the traffic coming from both Hacker News and Reddit raid.
| Traffic in numbers | |
|---|---|
| Requests (2021-02-14) | 93,275 |
| Requests (2021-02-15) | 46,390 |
| Total Requests | 139,665 |
| Unique Requests | 68,123 |
| Outgoing Bandwidth | ~6 GB |
The bandwidth number was fetched from the HAProxy dashboard. It’s an estimate, since the number on the dashboard also contained requests before this event, but the regular traffic is obviously much smaller.
| Page | Requests | Total |
|---|---|---|
| /posts/the-complexity-that-lives-in-the-gui/ | 69,422 | 50.53 % |
| /posts/on-navigating-a-large-codebase/ | 49,803 | 36.25 % |
| /posts/ | 4218 | 3.07 % |
| /posts/index.html | 2050 | 1.49 % |
| /posts/its-just-a-button/ | 1586 | 1.15 % |
| Referring Sites | Requests | Total |
|---|---|---|
| news.ycombinator.com | 33,918 | 59.60 % |
| blog.royalsloth.eu | 10,817 | 19.01 % |
| reddit.com | 3701 | 6.50 % |
| google.com | 2375 | 4.67 % |
| t.co (Twitter) | 1444 | 2.54 % |
The numbers for referring sites are much smaller than the ones from the page section, since not all requests contain the Referer header. While it’s nice to know where the traffic is coming from, the Referer header also represents a potential leak of information. The server logs often contain a Referer that points to the company’s internal wiki pages. Not the best way to keep your future plans secret.
<redacted ip> - - [25/Mar/2021:13:56:39 +0100]
"GET /posts/the-complexity-that-lives-in-the-gui/ HTTP/1.1" 200 16807
"https://<redacted>/display/RD/2021-03-25+Architectural+Meeting+Notes"
"Mozilla/5.0 (Windows NT 10.0; Win64; x64; rv:78.0) Gecko/20100101 Firefox/78.0"
Apparently, Google is also prioritising your pages during the raid which will lead to additional influx of traffic; in this case 4.7 % of the total traffic came from Google.
Traffic by location
| Traffic per continent | Requests | Total |
|---|---|---|
| North America | 72,401 | 51.84 % |
| Europe | 50,965 | 36.49 % |
| Asia | 9038 | 6.47 % |
| Oceania | 3950 | 2.83 % |
| South America | 1472 | 1.05 % |
| Unknown | 1087 | 0.78 % |
| Africa | 752 | 0.54 % |
| North America | Requests | Total |
|---|---|---|
| United States | 66,039 | 47.28 % |
| Canada | 5825 | 4.17 % |
| Mexico | 241 | 0.17 % |
| Costa Rica | 74 | 0.05 % |
| Europe | Requests | Total |
|---|---|---|
| Germany | 10,494 | 7.84 % |
| United Kingdom | 7909 | 5.66 % |
| France | 4877 | 3.49 % |
| Netherlands | 3073 | 2.20 % |
| Sweden | 2597 | 1.86 % |
| Asia | Requests | Total |
|---|---|---|
| India | 2887 | 6.47 % |
| Israel | 999 | 0.72 % |
| Japan | 944 | 0.68 % |
| Singapore | 820 | 0.59 % |
| Oceania | Requests | Total |
|---|---|---|
| Australia | 3154 | 2.26 % |
| New Zealand | 1939 | 2.85 % |
| United States Minor Outlying Islands | 2 | 0.00 % |
| French Polynesia | 1 | 0.00 % |
| Papua New Guinea | 1 | 0.00 % |
| Africa | Requests | Total |
|---|---|---|
| South Africa | 385 | 0.28 % |
| Egypt | 92 | 0.07 % |
| Kenya | 57 | 0.04 % |
| Nigeria | 42 | 0.03 % |
| Algeria | 31 | 0.02 % |
Traffic by time
+------+----------+----------+-------------------------------------+
| Hour | Requests | Total    | Visualization                       |
+------+----------+----------+-------------------------------------+
   00    3387       2.43 %   ||||||||||||
   01    2719       1.95 %   ||||||||||
   02    2682       1.92 %   ||||||||||
   03    1987       1.42 %   |||||||
   04    2756       1.97 %   ||||||||||
   05    5125       3.67 %   ||||||||||||||||||
   06    5198       3.72 %   ||||||||||||||||||
   07    5748       4.12 %   ||||||||||||||||||||
   08    6668       4.77 %   |||||||||||||||||||||||
   09    6807       4.87 %   ||||||||||||||||||||||||
   10    5754       4.12 %   ||||||||||||||||||||
   11    4807       3.44 %   |||||||||||||||||
   12    6916       4.95 %   ||||||||||||||||||||||||
   13    7956       5.70 %   ||||||||||||||||||||||||||||
   14    9048       6.48 %   |||||||||||||||||||||||||||||||
   15    9354       6.70 %   |||||||||||||||||||||||||||||||||
   16    8548       6.12 %   ||||||||||||||||||||||||||||||
   17    8593       6.15 %   ||||||||||||||||||||||||||||||
   18    7392       5.29 %   ||||||||||||||||||||||||||
   19    6817       4.88 %   ||||||||||||||||||||||||
   20    5653       4.05 %   ||||||||||||||||||||
   21    5371       3.85 %   |||||||||||||||||||
   22    5588       4.00 %   ||||||||||||||||||||
   23    4791       3.43 %   ||||||||||||||||
The majority of requests were made between 15:00-16:00 UTC with a total of 9354 requests or 2.6 requests/s. The requests usually do not come one after another, but even if they come in bursts, this traffic is close to nothing for what a modern server is capable of serving.
Traffic by users
| Operating Systems | Requests | Total |
|---|---|---|
| Darwin | 32,264 | 23.10 % |
| Macintosh | 23,959 | 17.15 % |
| Android | 19,644 | 14.07 % |
| Windows | 19,271 | 13.80 % |
| iOS | 17,479 | 12.51 % |
| Unknown | 14,508 | 10.39 % |
| Linux | 12,011 | 8.60 % |
| Known bots | 251 | 0.18 % |
| Chrome OS | 222 | 0.16 % |
| BSD | 56 | 0.04 % |
I don’t know which device identifies with a Darwin user agent, but judging from the server logs it probably comes from a broken iOS application that caused a huge amount of requests in a short period of time. See the Infrastructure section for more details.
| Browsers | Requests | Total |
|---|---|---|
| Unknown | 41,257 | 29.54 % |
| Chrome | 38,983 | 27.91 % |
| Safari | 25,276 | 18.10 % |
| Firefox | 23,971 | 17.16 % |
| Other | 3940 | 2.82 % |
| Crawlers | 3601 | 2.58 % |
| Feeds | 854 | 0.61 % |
Judging by the browser version breakdown, the vast majority of visitors were using the latest browser; either due to tech-savvy audience or auto updating functionality that a modern software enforces. Wonderful news for programmers that are writing the websites.
Infrastructure
The server is hosted on the cheapest 3.04 €/month (cca. $3.7 at current rates) plan at Hetzner 1 and is located in Germany. The server specifications for this plan are:
| Part | |
|---|---|
| CPU | 1 vCPU |
| RAM | 2 GB |
| Disk | 20 GB SSD |
| Traffic | 20 TB outgoing, ∞ incoming |
Hetzner definitely has the best deal for renting a small virtual machine and I don’t see any reason why would other providers charge more for objectively worse hardware and less outgoing traffic (AWS, Google Cloud, Azure, Linode, Digital Ocean).
This blog is generated with Hugo and is using a custom template in order to keep the page size small. Unfortunately, a vast majority of Hugo templates out there are cobbled together with megabytes of cruft that you don’t really need for serving a simple blog. A typical blog post currently sits at around 100kB on the first request (half of that are fonts). After the first request, the assets are cached on the client and every subsequent request has to transfer only the html file, which is usually quite small (cca. 20kB).
All the static files (fonts, css, images) are served locally via Nginx which sits behind the HAProxy. If there is ever a need to scale this blog beyond one server, adding a new server into the mix is a simple one line change in the HAProxy config. The main reason why I am using HAProxy instead of Nginx for proxying the traffic, is due to its excellent dashboard page.
The following screenshots are taken directly from the Hetzner’s server dashboard on the first day of the raid:
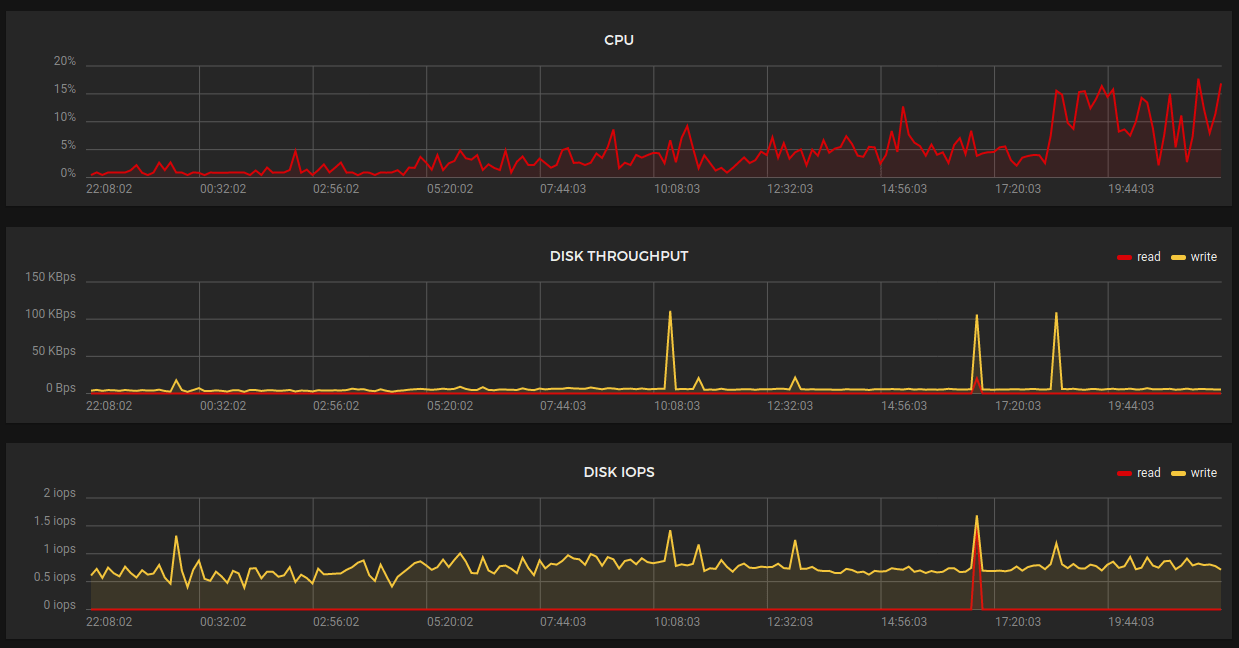
CPU was mostly idling at 0-5%. The cause of the CPU spike at around 18:00 was apparently a broken iOS client for Hacker News which kept making requests until fail2ban banned the IP. Hordes of people just kept hammering the poor server, but the server didn’t care.
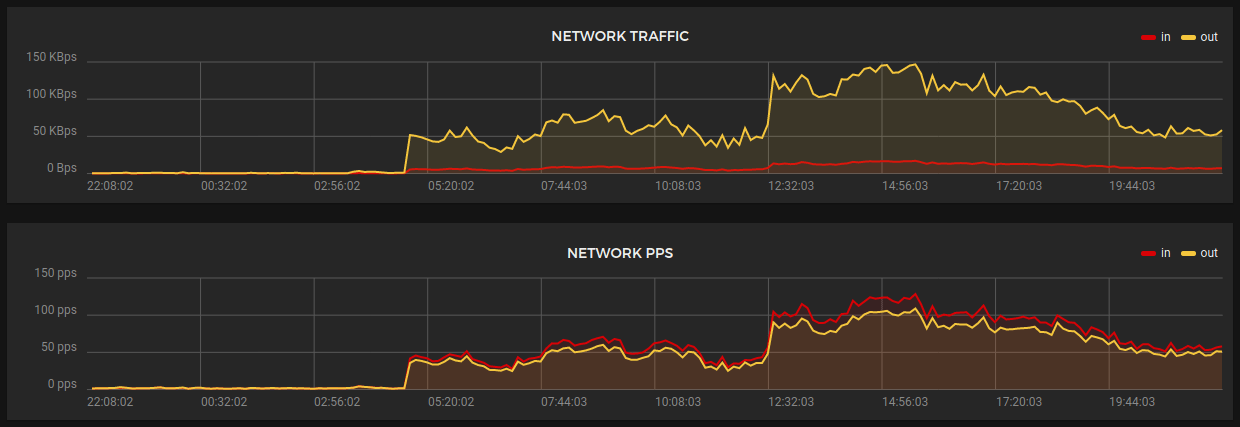
Network traffic peaked at 150 KBps which is close to nothing for a server that is sitting in the data center with a 10 Gbps connection.
It’s a wrap
Occasionally I see blog posts about someone’s infrastructure for serving a blog, and it boggles my mind how much money they are throwing down the drain for serving a few pages. If you can’t handle 100,000 requests per day on a small virtual machine, you are doing it wrong. Tune your websites!
No request is faster than the one that was not made.
Ilya Grigorik (High performance browser networking)
Notes
Referral link, you get $20 for signing up and I get some free server credits for every person that signed up with this link. ↩︎